// 2026-05-12 · Maps & Exploration · by Bob Smith
Windy: The Weather Map That Actually Looks Like Weather
Windy is an animated weather map showing live wind, rain, temperature, waves and storms as flowing lines you can watch move across the planet. Free, no account.
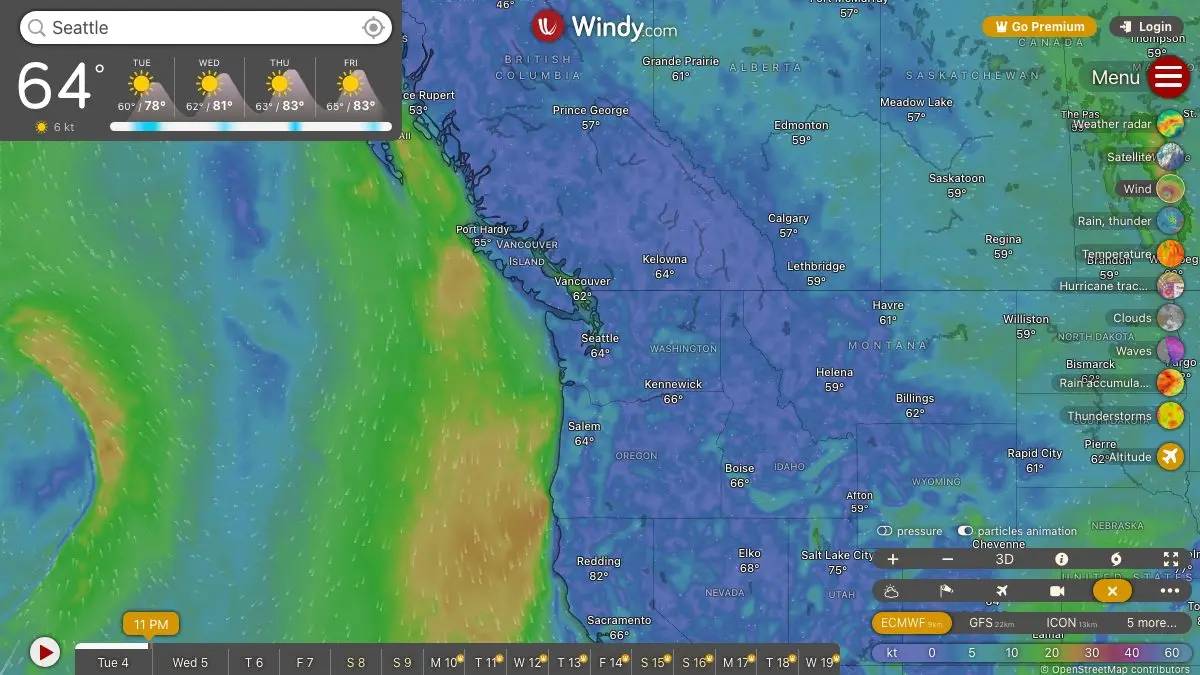
Windy is a weather map you watch rather than read. Instead of a row of little cloud icons, you get the actual atmosphere: wind drawn as thousands of flowing streamlines, rain rolling across continents, hurricanes spiraling in real time. Zoom anywhere on Earth, pick a layer, hit play.
You came to check tomorrow’s forecast. Twenty minutes later you are watching a jet stream whip across the North Atlantic. Happens to everyone.
What is Windy?
Windy started as a wind visualization for pilots and paragliders and turned into one of the best weather tools on the internet. The core idea is that weather is a fluid, so it should be drawn like one. The animation is not decoration, once you have seen wind as moving lines, a static arrow map feels like reading sheet music instead of hearing the song.
Underneath the pretty part is real forecasting data. Windy pulls from multiple global models and lets you flip between them on the same spot. When ECMWF and GFS agree, you can pack accordingly. When they disagree wildly, you have learned something more useful than any single confident forecast would have told you.
Then there are the layers, and the layers are where the hours go.
What can you do on Windy?
- Stack the layers. Wind, gusts, temperature, rain and thunder, snow cover, cloud base, waves, swell, currents, air quality, CO concentration, pressure, humidity. Each one repaints the whole planet.
- Scrub the timeline. Drag the bar at the bottom and run the forecast forward for days. Watch a front arrive before it arrives.
- Track storms. Hurricane and cyclone tracks show the projected paths from multiple agencies, so you can see the spread of the forecast cone.
- Compare models. One click switches the same view between forecast models. Disagreement is information.
- Watch webcams. Thousands of live cameras are pinned to the map. Click one and see whether it is actually raining there right now.
- Read the detailed point forecast. Click any spot for a full meteogram: hourly wind, temperature, rain and cloud layers in one chart.
- Check airports. Airport markers give live METAR reports and runway wind, which is deeply satisfying even if you never intend to fly anything.
Tips to get the most out of it
Turn on the wind animation and just leave it running. Set the layer to wind, zoom out to a hemisphere, press play on the timeline. It is the single best thing on the site and most people never do it.
Use the vertical sounding. Click a location and open the sounding or airgram view. It shows the atmosphere in cross-section, layer by layer, cloud base, inversions, wind at altitude. This is the stuff paragliders and pilots come for.
Compare two models before trusting a forecast. Same place, same hour, switch model. If they match, the forecast is solid. If one says sunshine and the other says storm, plan for chaos.
Try the waves and swell layers even inland. Watching the Southern Ocean throw ten-meter swell around is free entertainment and puts a very small boat in perspective.
Use the distance and area tools. Windy has a ruler and route planner tucked in the menu, handy for sailing legs or working out how far that squall line is from your weekend.
Save your favorite spots. A free account keeps a list of locations so you can jump between home, the coast and wherever you are going without searching each time.
If you like Windy, also try…
- earth :: nullschool: the same idea rendered as a spinnable 3D globe, with ocean currents and particulate layers. Hypnotic in a different key.
- Blitzortung Lightning Map: every lightning strike on Earth, plotted seconds after it happens.
- Flightradar24: live aircraft instead of live weather, and the two are more related than you would think.
- wttr.in: the opposite approach: your forecast as ASCII art in a terminal.
The rest of our Maps & Exploration collection is full of similar time sinks.
Frequently asked questions
What is Windy?
Windy is an interactive weather map that renders forecasts as animated visuals, wind as flowing streamlines, rain as moving cloud, temperature as color. You can stack layers like radar, waves, air quality and hurricane tracks over any point on Earth, and scrub forward through the forecast hour by hour.
Is Windy free?
Yes. The full map, all the main layers, the forecast timeline and the webcams are free to use in a browser with no account required. Windy also sells an optional premium tier that adds finer forecast steps and extra features, but the everyday version costs nothing.
Which weather models does Windy use?
Windy displays several global and regional forecast models side by side, including ECMWF and GFS, plus local high-resolution models in some regions. You can switch between them on the same location to see whether the forecasts agree, which is a quick sanity check on how confident the forecast really is.
Can I use Windy for flying, sailing or surfing?
Windy is popular with pilots, sailors and surfers because it exposes specialist layers most weather apps hide, such as wind at altitude, wave height and period, swell direction, CAPE and airport METAR reports. It is a planning and visualization tool, not an official aviation or marine briefing service, so serious trips still need official sources.